

http://www.edwardtufte.com/tufte/books_vdqi
Related: data visualisation37 Data-ish Blogs You might not know it, but there are actually a ton of data and visualization blogs out there. I'm a bit of a feed addict subscribing to just about anything with a chart or a mention of statistics on it (and naturally have to do some feed-cleaning every now and then). In a follow up to my short list last year, here are the data-ish blogs, some old and some new, that continue to post interesting stuff. Data and Statistics By the Numbers - Column from The New York Times visual Op-ed columnist, Charles Blow, who also used to be NYT's graphics director.Data Mining - Matthew Hurst, scientist at Microsoft's MSN, also the co-creator of BlogPulse.Statistical Modeling - We might disagree on certain things, but Andrew's blog is one of the few active pure statistics blogs.The Numbers Guy - Data-minded reporting from Carl Bialik of the Wall Street Journal.Basketball Geek - Like statistical analysis and basketball? Statistical/Analytical Visualization
Vision Statement (HBR) Text by Daniel McGinn; illustration by Stephanie Crowley For a big client meeting in April, Accenture senior manager Mark Papia hired a type of practitioner he’d never encountered before: a “graphic recorder.” During the session, artist Julie Stuart drew large murals depicting the participants’ discussion on 4-foot-by-8-foot sheets of paper. The goal: to help people make connections and better recall key points. “The artwork generated a tremendous amount of interaction,” Papia says. Graphic recording—also called visual facilitation—has been around since at least the 1970s, when it was popularized by a group of San Francisco architects.
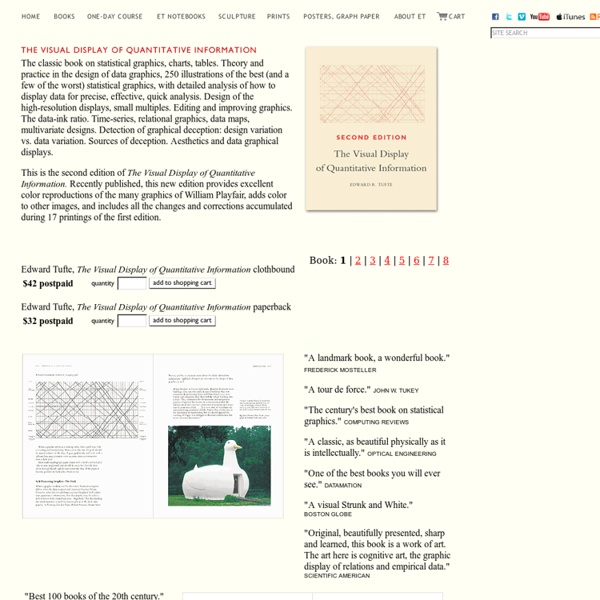
Data science We’ve all heard it: according to Hal Varian, statistics is the next sexy job. Five years ago, in What is Web 2.0, Tim O’Reilly said that “data is the next Intel Inside.” But what does that statement mean? Why do we suddenly care about statistics and about data? Tufte, Edward Edward Tufte is a statistician and artist, and Professor Emeritus of Political Science, Statistics, and Computer Science at Yale University. He wrote, designed, and self-published 4 classic books on data visualization. The New York Times described ET as the "Leonardo da Vinci of data," and Business Week as the "Galileo of graphics." He is now writing a book/film The Thinking Eye and constructing a 234-acre tree farm and sculpture park in northwest Connecticut, which will show his artworks and remain open space in perpetuity. He founded Graphics Press, ET Modern gallery/studio, and Hogpen Hill Farms LLC. Visual Display of Quantitative Information 200 pages
laws Organization makes a system of many appear fewer. The home is usually the first battleground that comes to mind when facing the daily challenge of managing complexity. Stuff just seems to multiply. There are three consistent strategies for achieving simplicity in the living realm: 1) buy a bigger house, 2) put everything you don’t really need into storage, or 3) organize your existing assets in a systematic fashion. These typical solutions have mixed results. Diagram Software - The Best Choice for Diagramming All-in-one diagram software that makes it perfect for the following diagram software types. What's the diagram solution? Buy one diagram software that suits one group but forces the other to compromise and make do? Or purchase some separate diagram software for each department's special needs and hope that your company approves the purchase? What about none of the above?
Grove Copyright Policy The Grove’s models and templates are the intellectual property of The Grove Consultants International and are based on best practices drawn from more than thirty years of fieldwork. The Grove is committed to sharing its ideas, processes, and tools in order to foster collaboration, and while we strive to make these easily accessible, only authorized licensees may use our proprietary information and materials. Such licensees must acknowledge The Grove as their source by displaying a Grove copyright notice and may reproduce such proprietary information only with our express written permission. Any unauthorized reproduction or use of our copyrighted material without The Grove’s express written permission is a violation of U.S. copyright law. If you wish to use our copyrighted material, we are happy to assist you with a purchase or discussion of an appropriate licensing arrangement.
TreeSheets A "hierarchical spreadsheet" that is a great replacement for spreadsheets, mind mappers, outliners, PIMs, text editors and small databases. Suitable for any kind of data organization, such as todo lists, calendars, project management, brainstorming, organizing ideas, planning, requirements gathering, presentation of information, etc. It's like a spreadsheet, immediately familiar, but much more suitable for complex data because it's hierarchical. It's like a mind mapper, but more organized and compact.